
In the SaaS Industry, the only constant is change. It’s like a game of whack-a-mole – as soon as you solve one problem, another one pops up.
If you’re a SaaS business owner, you know the struggle for growth is real. But with so many metrics to track and analyze, it takes time to know where to focus your efforts.
And the scoop is- SaaS businesses are like snowflakes – no two are the same.
Well,
Here the secret to success is all in the numbers! By tracking the right metrics, you’ll be able to gain valuable insights into your business and make data-driven decisions that drive growth.
And let’s face it, who doesn’t want their business to skyrocket?
But where do you start? With so many metrics out there, it can be overwhelming to figure out which ones to focus on. That’s why we’ve got you covered!
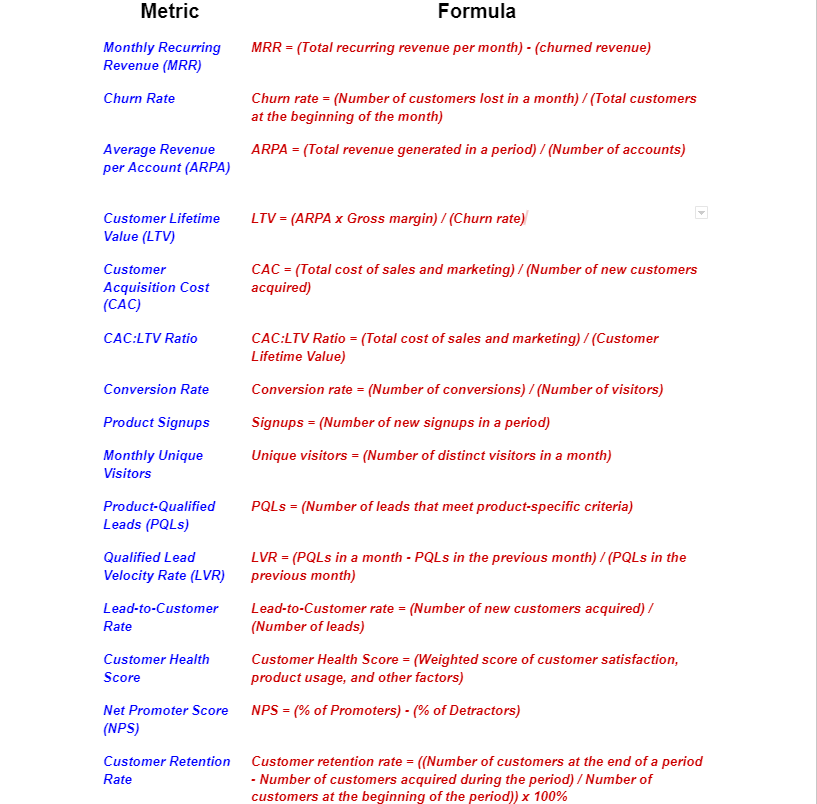
In this blog post, we’ll walk you through the 15 most critical SaaS growth metrics you need to track to optimize your growth strategy.
And trust us, by understanding what each metric means, why it’s important, and how to use it, you’ll be on your way to achieving that coveted revenue growth rate of 20% or higher. So, get ready to roll up your sleeves and dive into some data analysis.
✅To get reliable data instead of relying on assumptions or guesswork
✅Identify areas for improvement
✅Optimize your growth strategy to focus on the most effective tactics and channels.
✅Gain a deeper understanding of your business, its strengths, and weaknesses
✅More accurate predictions and forecasts, allowing you to plan for the future effectively.
✅Increased profitability by enabling you to identify growth opportunities
✅Helps gain a competitive advantage.
Monthly Recurring Revenue (MRR) is one of the most important metrics for SaaS businesses to track, and it’s a great way to get a sense of how predictable and reliable a company’s revenue streams are.
Companies like Slack, Hubspot, and Zoom rely heavily on MRR to forecast their revenue, understand their customer acquisition costs, and track the success of their pricing strategies.
How to Measure:
So, how do you measure MRR? To measure MRR, you need to first determine your average monthly revenue per customer and then multiply that by the number of active customers you have in a given month.
MRR = Total number of paying customers x Average revenue per user (ARPU)
For example, if a SaaS business has 100 paying customers who each pay $50 per month, their MRR would be $5,000.
MRR includes all monthly subscription fees customers pay but doesn’t include one-time sales or other sporadic revenue streams.
How to use it
MRR can be used to:
Losing customers is like losing money. And for SaaS businesses, churn rate is the metric that measures just that – the percentage of customers who cancel their subscriptions or stop using the product over a certain period. High churn rates can lead to revenue loss, and low customer retention rates can hinder growth.
Top companies that use Churn Rate as a key metric include Netflix, Spotify, and HubSpot. These companies have consistently low churn rates, indicating that they have a strong customer retention strategy in place.
How to Measure:
To measure churn rate, businesses must track the number of customers who cancel or leave their subscription each month and divide that by the total number of customers at the beginning of the month.
Formula: Churn Rate = Number of customers lost in a month ÷ Total number of customers at the beginning of the month
For example, if a company had 1000 customers at the beginning of the month and lost 100 customers during the month, then the churn rate for that month would be 10%.
How to use it
CRR measures the’ %’ of customers who stick with a company’s product/service. SaaS firms use it to assess retention strategies and identify ways to improve customer onboarding, support, and engagement initiatives.
How to Measure:
Formula: CRR = ((E-N)/S)) x 100
Example: If a company starts the month with 500 customers (N), ends with 550 customers (E), and acquires 100 new customers (S) during the month, the CRR would be ((550-500)/500) x 100 = 10%.
How to use it
To use CRR effectively, companies should track it over time, compare it with industry benchmarks, and use it to inform their customer retention strategies.
ARPA (Average Revenue Per Account) calculates the average monthly or annual revenue earned per customer account. It helps businesses understand the revenue generated from each customer and measure the effectiveness of their pricing strategies. H
How to Measure:
Formula: Total Monthly Recurring Revenue / Total Number of Accounts
How to use it
CLV measures the total revenue a customer will generate over their lifetime. Top SaaS companies use it to determine profitable segments and inform acquisition and retention strategies. For example, upselling high-value customers can increase CLV.
How to Measure:
To measure CLV, you can use the following formula: CLV = (Average Revenue per User (ARPU) x Gross Margin) / Churn Rate
For example, if a SaaS business has an ARPU of $50, a gross margin of 80%, and a churn rate of 5%, the CLV would be: CLV = ($50 x 0.80) / 0.05 = $800
How to use it
Customer Acquisition Cost (CAC) is a SaaS growth metric that measures the cost of acquiring a new customer. It considers all marketing and sales expenses incurred to attract and convert a prospect into a paying customer.
How to Measure:
Formula: CAC = (total sales and marketing expenses) / (number of new customers acquired)
For example, if a SaaS company spent $100,000 on marketing and sales and acquired 100 new customers, the CAC would be $1,000.
How to use it
The CAC: LTV Ratio compares the cost of acquiring a customer to their lifetime value. SaaS companies like Zendesk and DocuSign use it to evaluate the efficiency of their sales and marketing strategies and optimize their customer acquisition efforts for improved profitability.
How to Measure:
To calculate the CAC: LTV ratio, divide the cost of acquiring a customer by the customer’s lifetime value.
CAC: LTV Ratio = Customer Acquisition Cost (CAC) ÷ Customer Lifetime Value (LTV)
Here,
CAC = (Total Sales and Marketing Expenses) / (Number of New Customers Acquired)
LTV = (Average Revenue Per Customer * Customer Lifespan)
where Average Revenue Per Customer = (Total Revenue) / (Total Number of Customers)
and Customer Lifespan = (Sum of Customer Lifespans) / (Total Number of Customers)
For example,
Let’s say a SaaS company spent $50,000 on marketing and sales expenses in a month and acquired 500 new customers during that period. This means the average CAC for that month would be:
CAC = $50,000 ÷ 500 = $100
Now, let’s assume the average revenue per customer is $100 per month and the average customer lifespan is 24 months. This means the LTV for each customer would be:
LTV = $100 × 24 = $2,400
So the CAC: LTV ratio for this company would be:
CAC: LTV Ratio = $100 ÷ $2,400 = 0.04
How to use it
Conversion Rate measures the percentage of website visitors who complete a desired action, reflecting a business’s marketing and website design effectiveness. HubSpot uses it to measure landing page and email marketing success, while Dropbox tracks it to optimize the website design and improve user experience.
How to Measure:
Formula: (Number of conversions / Number of visitors) x 100%
How to Use It
Product signups refer to the number of new users registered for a software product or service. Top SaaS companies use this metric to track their user acquisition and measure the effectiveness of their marketing campaigns.
How to Measure:
Product sign-ups can be measured by tracking the number of users who have registered for a company’s product or service over a specific period.
Note: It’s important to distinguish between product signups and actual paying customers, as signups do not necessarily equate to revenue.
How to Use It
To use this metric, companies can compare it to other metrics, such as conversion rate and customer acquisition cost, to optimize their marketing efforts and improve their user acquisition strategies.
Monthly Unique Visitors (MUV) measures the number of distinct individuals who visit a website within a specific timeframe, typically a month. It indicates the popularity and reach of a website, which is critical for businesses to monitor and improve to attract more potential customers.
SaaS companies use this metric to evaluate the effectiveness of their website traffic generation strategies and improve their online presence.
How to Measure:
MUV can be measured using website analytics tools like Google Analytics.
How to Use It
Using the metric, you can track website traffic growth over time and analyze the effectiveness of marketing campaigns. Popular pages can be improved to increase engagement and conversions.
Product-Qualified Leads (PQLs) are potential customers who have shown a strong interest in a product by using it or taking specific actions, making them more likely to become paying customers.
SaaS companies use PQLs to focus their sales and marketing efforts on high-quality leads, leading to higher conversion rates and revenue growth.
How to Measure:
To measure PQLs, companies can track customer behavior, such as product usage or trial sign-up, or attending a demo, and apply a scoring system to identify qualified leads.
How to Use It
Companies use PQLs to focus their sales and marketing efforts on leads more likely to convert into paying customers. By identifying these leads early on, companies can optimize their sales and marketing strategies and improve their overall conversion rates.
Qualified Lead Velocity Rate (LVR) measures the growth rate of new qualified leads over a given period, indicating how well a business is generating high-quality leads. Salesforce uses LVR to monitor the performance of its sales team and optimize its sales process to improve the quality of leads and increase customer acquisition.
How to Measure:
To measure the Qualified Lead Velocity Rate (LVR), you need to calculate the growth rate of qualified leads over a specific period.
Formula: ((Q2 – Q1) / Q1) x 100%,
Where Q1 is the number of qualified leads at the beginning of the period, and Q2 is the number of qualified leads at the end of the period.
For example, if you started with 500 qualified leads in January and ended with 750 qualified leads in February, the LVR for February would be ((750-500)/500) x 100% = 50%.
How to Use It
LVR can be used to identify trends in lead generation, measure the impact of marketing and sales campaigns, and predict future growth potential. It helps companies make informed decisions about resource allocation, target setting, and marketing investments.
Lead-to-Customer Rate measures the percentage of leads that convert to paying customers. It’s a critical metric for assessing the effectiveness of sales and marketing efforts in generating revenue.
Companies use this metric to optimize their sales process, identifying where they’re losing potential customers and improving their strategies to increase conversion rates.
How to Measure:
To measure the Lead-to-Customer Rate, divide the number of new customers gained in a period by the total number of leads generated in that period and multiply by 100 to get a percentage.
Formula: Lead-to-Customer Rate = (Number of new customers / Total number of leads) x 100%
How to Use It
Customer Health Score measures customers’ overall satisfaction and engagement. Top SaaS companies use it to identify customers at risk of churning and provide targeted interventions to improve their experience.
How to Measure:
To measure the Customer Health Score, a company can use quantitative and qualitative data such as product usage metrics, Net Promoter Score (NPS), customer feedback surveys, and support ticket data.
A formula is typically used to weigh the different factors and generate a score between 0-100.
Formula: Customer Health Score = (50% usage metrics + 30% NPS + 20% support ticket data) * 100
How to Use It
Net Promoter Score (NPS) is a metric that measures customer loyalty and satisfaction by asking customers to rate how likely they are to recommend the product or service to others on a scale of 0-10. The SaaS tycoons such as Netflix and Mailchimp leverage NPS to identify improvement areas and measure customer retention efforts’ success.
How to Measure:
To calculate the NPS, subtract the percentage of detractors (customers who rate the product/service between 0-6) from the percentage of promoters (customers who rate the product/service 9-10), then multiply by 100.
NPS = (Promoters % – Detractors %) x 100
For example, if 40% of customers are promoters, 30% are passives (rating 7-8), and 30% are detractors, the NPS would be (40% – 30%) x 100 = 10.
How to Use It
NPS can be used to identify areas of improvement, track customer satisfaction over time, and benchmark against industry competitors.
Metrics are the superheroes of the SaaS world, each with its unique superpowers. It’s like having a team of Avengers to help guide the business strategy! By measuring metrics, companies can take an informed approach to decision-making, helping them avoid pitfalls and identify growth areas.
So, whether you’re a startup or a unicorn, don’t forget to harness the power of metrics to supercharge your growth – gain valuable insights into your business and make data-driven decisions to optimize your growth strategy.
 Ameet Mehta
